You searched for how to improve LCP, which means something told you your Largest Contentful Paint is too slow and you now have a list of four or five fixes and one afternoon. This article is about which one to do.
Read this first, so you don't waste the afternoon
Open your PageSpeed Insights report and find the LCP breakdown panel. It splits LCP into four phases: time to first byte, resource load delay, resource load time, and element render delay.
One thing to know before you read it, because it catches people who arrive the way you probably did: the big LCP number at the top of a PSI report is CrUX field data from real visits, but the phase breakdown comes from the Lighthouse lab run underneath it. They are different datasets with different numbers, and the phases describe the lab load. Use the breakdown to work out which phase is your problem, not to predict what a fix is worth in the field. Then:
- If TTFB is your biggest slice, stop reading. Nothing in this article will help. That is a hosting, caching or database problem — our fixture runs on localhost with a median TTFB of 0.9 ms precisely so that everything measured here is the page's own contribution.
- If element render delay is your biggest slice, your paint is blocked by CSS, fonts or hydration rather than by the image. This article measures the boundary of that (our no-image control spent 363 ms there waiting on a render-blocking stylesheet) but does not fix it.
- If load delay or load time dominate, you are in the right place. The rest of this article is about which of those two to attack, and it is a decision you can make arithmetically rather than by vibes.
One scope note up front, because it changes how you read the numbers. The fixture images are all JPEG, and we did not run a format comparison across the weight sweep. The Next.js section further down is a different story: Next negotiates WebP by default, so those routes are served WebP and the format change is baked into that result. We measured what the optimizer returned rather than assuming, and it is not the win you would expect — see when these numbers do not apply.
What the received advice says
web.dev's LCP guide opens its optimization steps with "Eliminate resource load delay", tells you to "preload the LCP image with a high fetchpriority so it starts loading with the stylesheet", and reports that the "load duration portion of LCP tends not to be a significant bottleneck for most sites." It does also cover compression at length; the claim we are testing is the priority ordering, not whether it mentions file size.
We built a fixture to check that ordering, and for anything but an already-small image it comes out the other way round.
What we measured
One 1600x900 hero image, encoded at six weights from 18 KB to 804 KB, served five ways:
- a server-rendered
<img>in the HTML - the same, plus
<link rel="preload" as="image" fetchpriority="high">in the head andfetchpriority="high"on the element itself - the same, with
loading="lazy" - a CSS
background-imagein a second stylesheet - an
<img>inserted by a deferred script, so after parsing but beforeDOMContentLoaded
A sixth control page carries no hero at all, which gives the floor.
The five variants share the same page chrome, stylesheet and body text. They are not byte-identical: the CSS variant is a <div role="img"> rather than an <img>, and both it and the client-rendered variant carry an extra subresource (a second stylesheet and a script respectively), so those two make 5 requests where the three server-rendered variants make 4. The only deliberate difference is how the browser finds out the image exists.
That is 31 pages, each measured 7 times with a cold cache, on the Chrome DevTools Slow 4G preset (1.6 Mbps, 150 ms RTT) at 4x CPU throttling in a 412x823 viewport, then again on Fast 4G (9 Mbps, 40 ms RTT). Runs are interleaved round-robin rather than looped per page, so a machine that drifts busier during the 10-minute run biases every variant equally. A third experiment, added after a reader pointed out we had never tested it, measures preload on the hidden variants. 506 page loads in total, in headless Chrome 150.0.7871.24 on an Apple M5.
Everything is in our evidence folder — bench-results.json, bench-results-fast4g.json, preload-results.json — together with the measurement code that defines every metric, so "resource load delay" is a function you can read rather than a term you have to trust.
The shape of the result
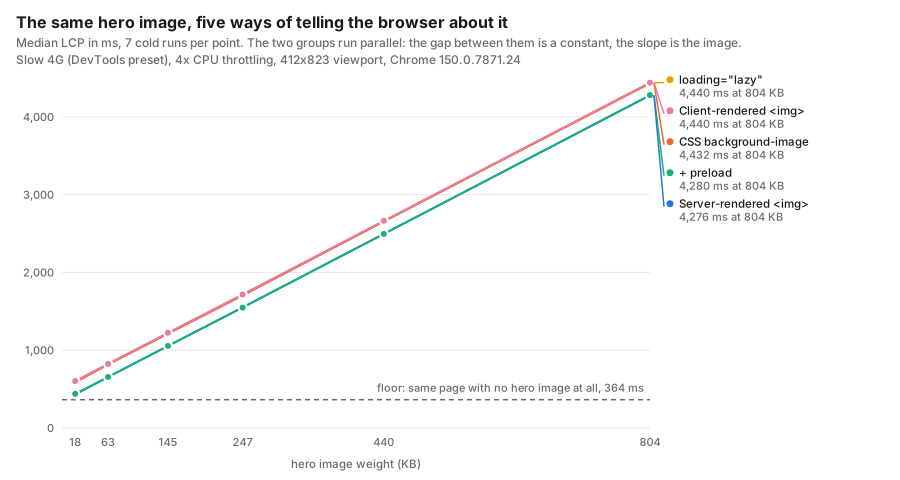
| Hero weight | Server <img> | + preload | loading="lazy" | CSS background | Client-rendered |
|---|---|---|---|---|---|
| 18 KB | 432 ms | 440 ms | 600 ms | 588 ms | 604 ms |
| 63 KB | 656 ms | 656 ms | 824 ms | 816 ms | 824 ms |
| 145 KB | 1,056 ms | 1,056 ms | 1,220 ms | 1,212 ms | 1,224 ms |
| 247 KB | 1,552 ms | 1,548 ms | 1,716 ms | 1,704 ms | 1,716 ms |
| 440 KB | 2,496 ms | 2,496 ms | 2,656 ms | 2,656 ms | 2,664 ms |
| 804 KB | 4,276 ms | 4,280 ms | 4,440 ms | 4,432 ms | 4,440 ms |
Medians of 7 cold runs. The widest min–max spread of any cell is 16 ms, against a smallest gap between the two groups of rows of 148 ms. Chrome reports LCP timestamps in 4 ms steps, so treat differences under about 8 ms as unresolvable.
Weight sets the slope. Fitting LCP against image weight for the server-rendered variant gives LCP ≈ 346 ms + 4.888 ms × KB, R² = 1.000. That slope is a property of the connection, not the image: Slow 4G is 1638.4 kbps, which is 204.8 KB/s, which is 4.883 ms per KB. Measured and theoretical agree to within 0.1%. On Fast 4G the fit gives 0.899 ms/KB against a theoretical 0.889.
Discovery is an offset. The three indirect variants sit a near-constant distance above the direct ones at every weight, which is why the lines run parallel instead of fanning out.
Preload did nothing, and then it did everything
On an <img> that is already in the server-rendered HTML, we could not measure any effect:
| Hero weight | Server <img> | + preload | difference | run ranges |
|---|---|---|---|---|
| 18 KB | 432 ms | 440 ms | +8 ms | 432–440 vs 432–448 |
| 63 KB | 656 ms | 656 ms | 0 ms | 652–664 vs 652–660 |
| 145 KB | 1,056 ms | 1,056 ms | 0 ms | 1,052–1,056 vs 1,056–1,060 |
| 247 KB | 1,552 ms | 1,548 ms | −4 ms | 1,552–1,556 vs 1,548–1,552 |
| 440 KB | 2,496 ms | 2,496 ms | 0 ms | 2,492–2,500 vs 2,492–2,496 |
| 804 KB | 4,276 ms | 4,280 ms | +4 ms | 4,276–4,280 vs 4,276–4,284 |
The ranges overlap at all six weights, though at 145 KB and 247 KB they meet only at a shared endpoint. Resource load delay is identical to within 0.6 ms. Note that this variant carries fetchpriority="high" on the element as well as the preload link, so the null result covers both hints, not just one.
The mechanism is unsurprising once you look at it rather than at the advice: Chrome's preload scanner reads ahead through the raw HTML and starts fetching <img src> before the parser has built the DOM. The hint tells it something it already knew.
The obvious follow-up is whether preload earns its reputation on an image that genuinely is hidden. We had not measured that, so we did — one weight (145 KB), nine cold runs, all eight pages in a single interleaved run, with the preload link alone this time and no fetchpriority on the element.
| Hero is | LCP, no hint | LCP + preload | change | load delay |
|---|---|---|---|---|
a visible <img> | 1,056 ms | 1,056 ms | 0 ms | 164.7 → 164.2 ms |
loading="lazy" | 1,224 ms | 1,056 ms | −168 ms | 337.7 → 164.3 ms |
a CSS background-image | 1,216 ms | 1,064 ms | −152 ms | 326.5 → 164.8 ms |
| inserted by a script | 1,228 ms | 1,064 ms | −164 ms | 338.5 → 164.6 ms |
Every hidden case returns to a load delay of 164.3–164.8 ms, which is what a directly visible image gets in the same run (164.2–164.7 ms). So preload does not partially mitigate the discovery penalty; it removes it. The three hidden variants land within 8 ms of the visible baseline once hinted, and all three differences are separated — no run-range overlap in any of them.
That includes the case we half-expected to behave differently. A preloaded CSS background still needs the stylesheet before it can paint, so it was reasonable to think the hint would only recover part of the delay. It recovers all of it: the fetch starts from the head regardless, and the stylesheet arrives in time to use it.
The rule, then, is not "preload your hero." It is preload buys back exactly what hiding the image costs, and nothing more. If the image is already visible to the parser, that is zero.
What late discovery actually costs
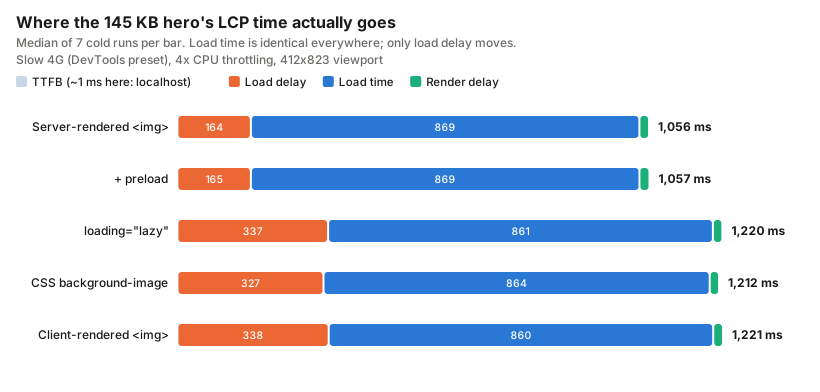
Split LCP into its four phases and only one of them moves. At 145 KB, load time is 860–869 ms across all five variants and render delay is 21.1–22.6 ms. Load delay takes two values: 164 ms when the parser finds the image, 327–338 ms when it does not. (The chart stacks phase medians, so its totals differ by a few ms from the LCP medians in the table above — 1,221 vs 1,224 for the client-rendered bar.)
The penalty, measured throughout as the load-delay difference against the plain server-rendered <img>, averaged across all six weights:
| How the image is hidden | Slow 4G (150 ms RTT) | Fast 4G (40 ms RTT) |
|---|---|---|
loading="lazy" | +173.0 ms | +60.7 ms |
Client-rendered <img> | +173.9 ms | +62.1 ms |
CSS background-image | +162.1 ms | +43.8 ms |
Preload on an already-visible <img> | 0 ms | 0 ms |
Each is roughly one extra network round trip, though not exactly: 173 ms against a 150 ms RTT is 1.15x, while 60.7 ms against a 40 ms RTT is 1.52x. The round trip is the mechanism, not a formula you can substitute for measuring. A CSS background URL cannot be discovered until the stylesheet has been fetched and the rule has matched an element; a client-inserted image cannot be discovered until its script has been fetched and run. Both are serial dependencies the preload scanner cannot see through.
The CSS background is consistently the cheapest of the three, despite carrying an extra render-blocking stylesheet. That is because the stylesheet itself is found by the preload scanner immediately and fetched in parallel with the document, so the background URL becomes known as soon as that CSS parses — earlier than a lazy image, which waits for layout to decide it is in the viewport.
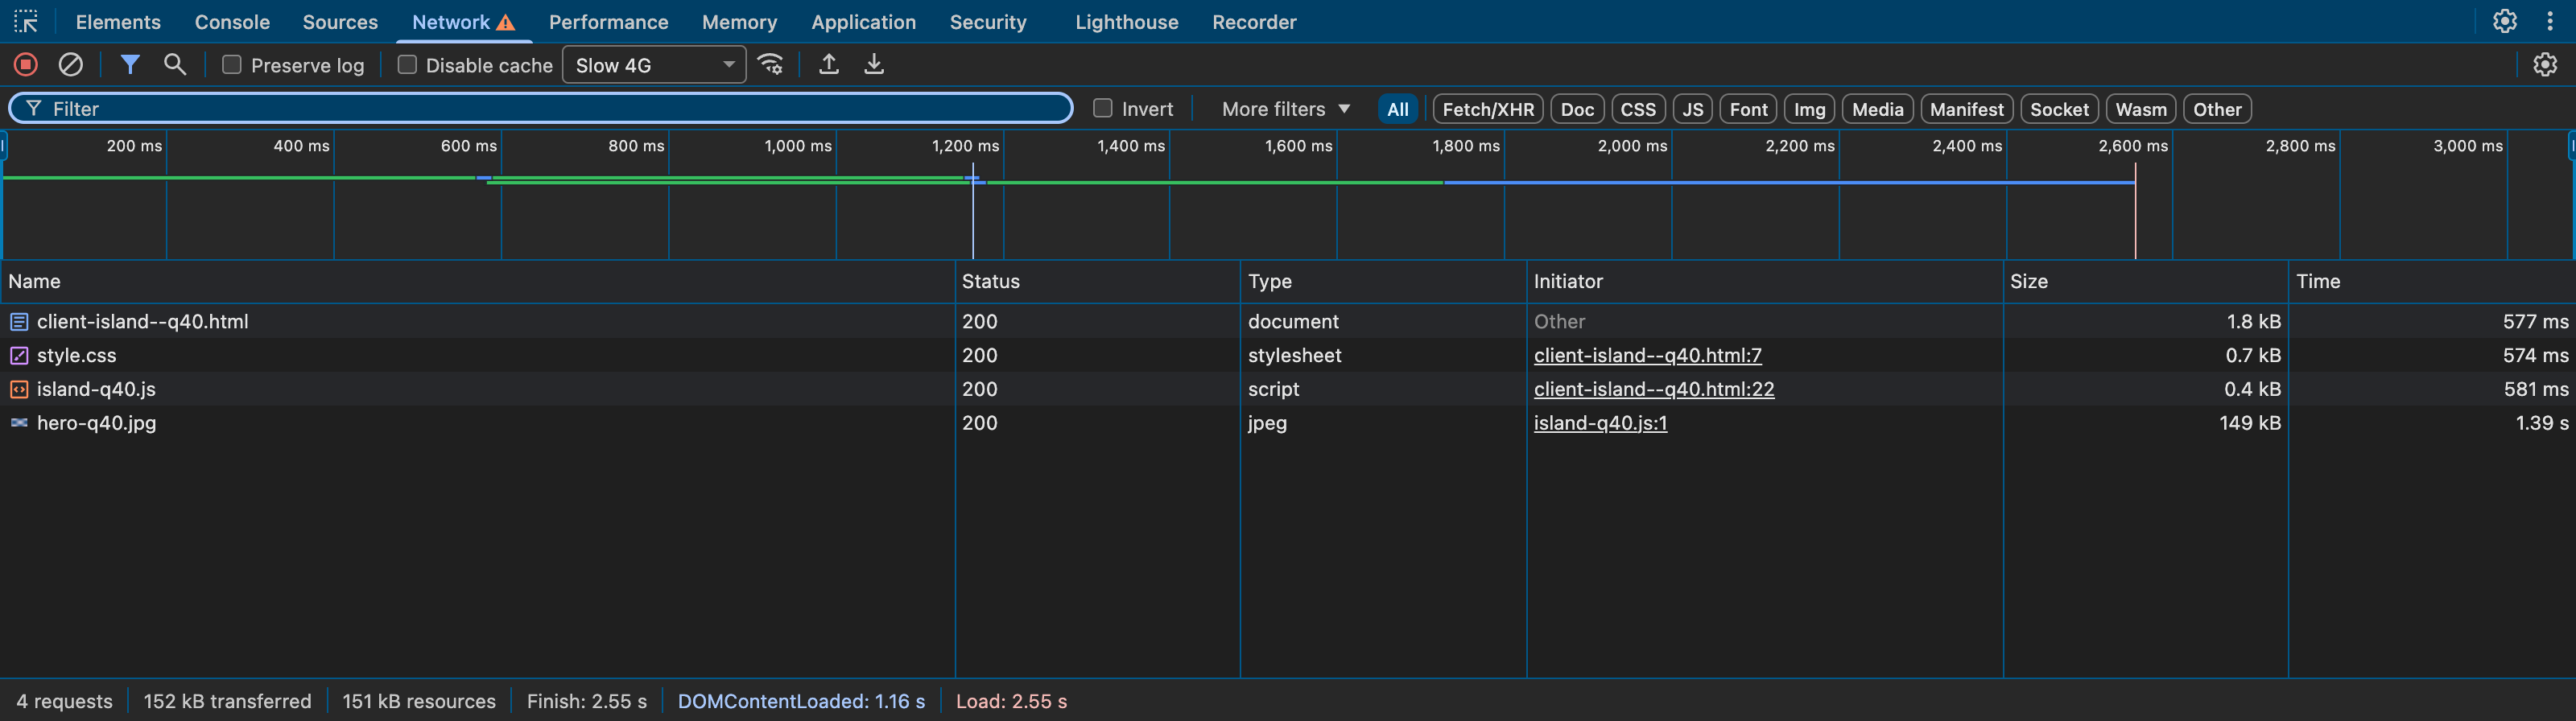
You can watch the mechanism in Chrome's own network panel. The client-rendered variant, where the Initiator column attributes hero-q40.jpg to island-q40.js rather than to the document:
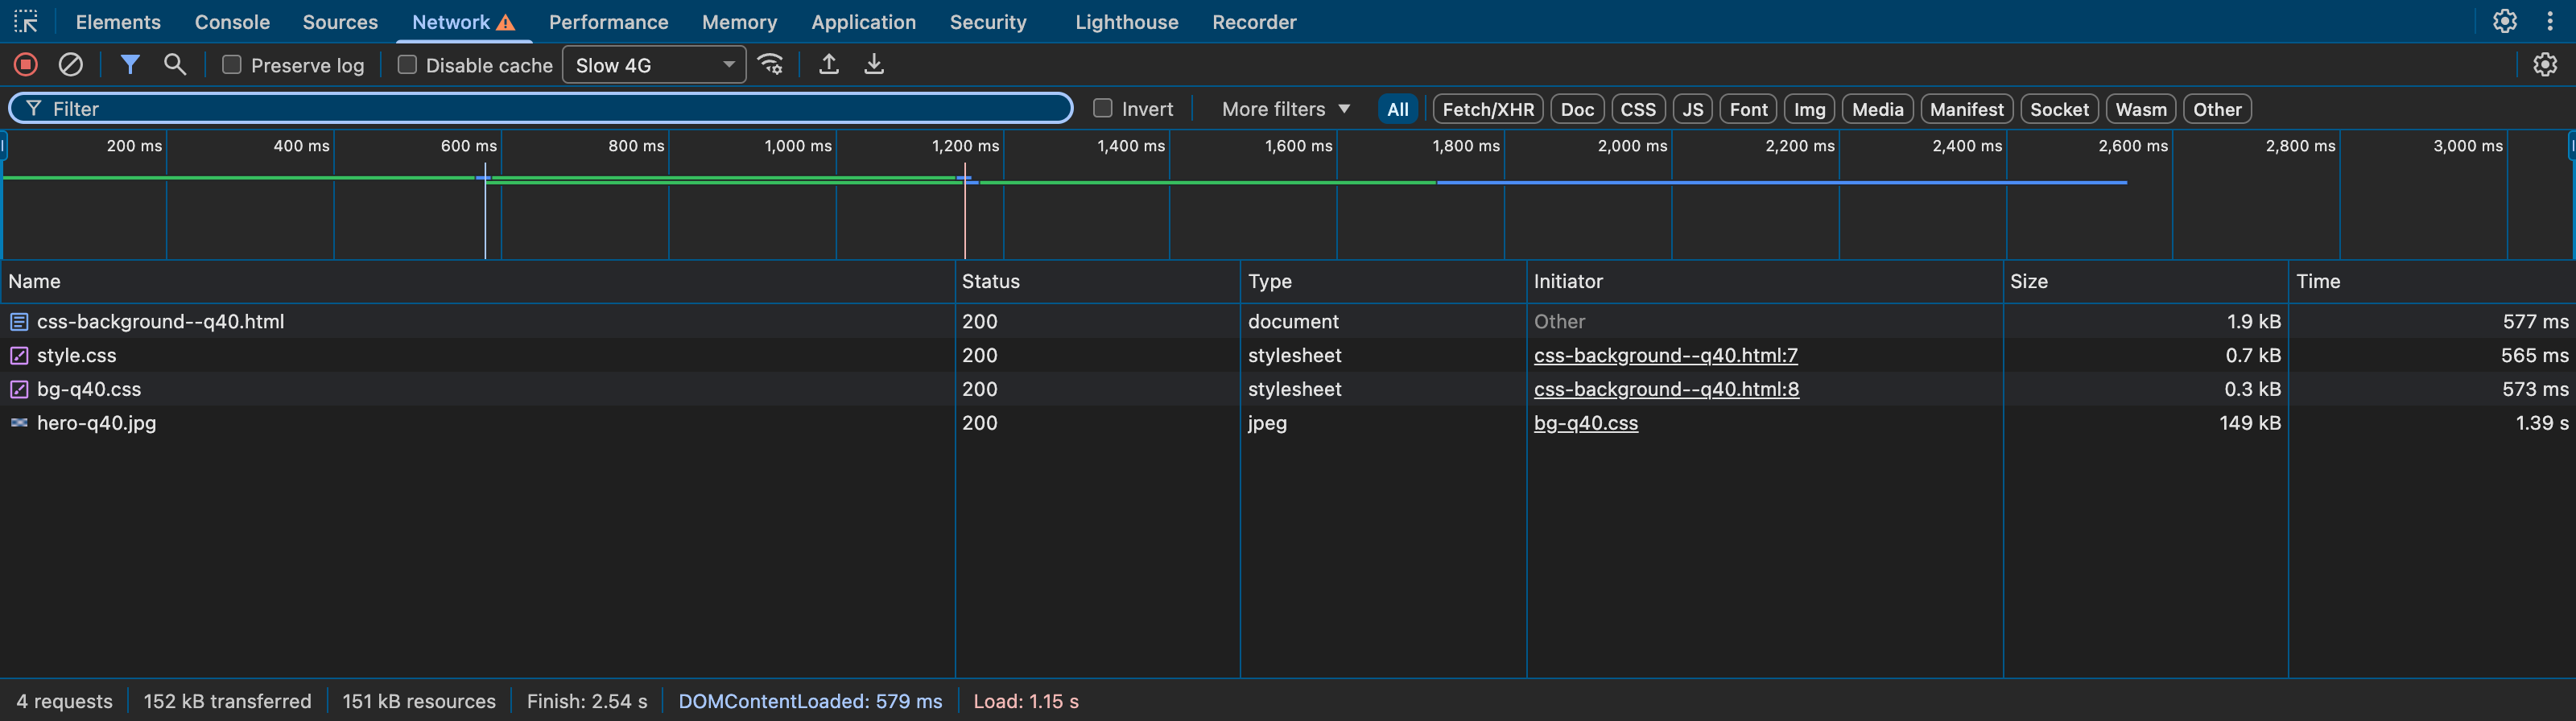
The CSS background variant, where it is attributed to the stylesheet:
And the server-rendered variant, which starts the image while the document is still arriving:
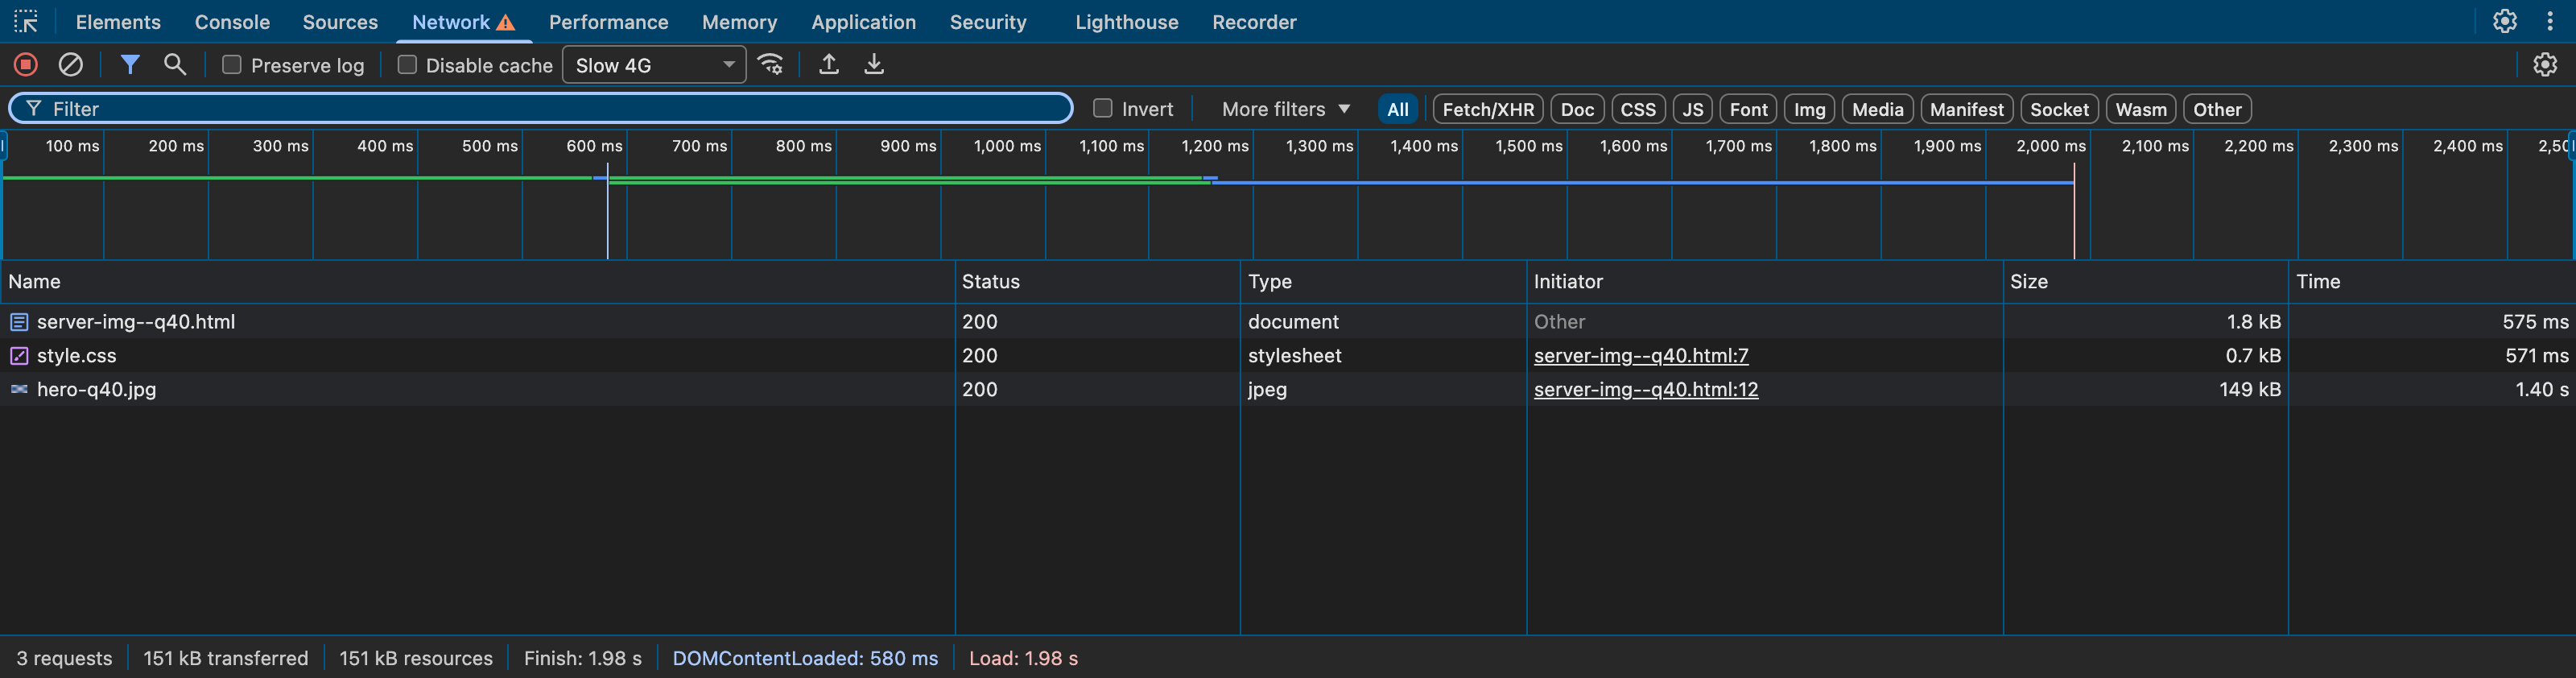
Those captures are single runs and their Finish times measure the load event, not LCP, so do not read the 570 ms difference between the first and last as the discovery penalty. The penalty is the 174 ms in the table; the screenshots are there to show you the Initiator column, which is the thing you will actually use to diagnose your own page.
One honest caveat on the client-rendered number. That fixture's script is under 1 KB, so 173.9 ms is the cost of the round trip alone. A real client-only hero sits behind a framework bundle that has to download, parse and execute first, so treat it as a floor.
Where the crossover is
A discovery fix buys a fixed number of milliseconds. A compression fix buys KB saved × ms per KB. They break even at:
crossover KB = measured discovery penalty (ms) ÷ ms per KB

Slow 4G:  173.0 ÷ 4.888  =  35 KB   (lazy)
          162.1 ÷ 4.888  =  33 KB   (CSS background)
Fast 4G:   60.7 ÷ 0.899  =  68 KB   (lazy)
           43.8 ÷ 0.899  =  49 KB   (CSS background)
So on Slow 4G, un-lazying your hero is worth about as much as taking 35 KB off it. If your hero is 400 KB and you can get it to 100 KB, that is 300 KB × 4.888 = 1,466 ms, and the discovery fix is a rounding error next to it. If your hero is already 40 KB, there is little left to compress and the discovery fix is most of what is available.
The crossover rises on faster connections — from 33–35 KB to 49–68 KB — because bytes get cheaper while round trips do not. Loosely, it tracks the bandwidth-delay product, which is why it moves in that direction. Do not compute it that way, though: RTT × bandwidth gives 30.7 KB on Slow 4G against the 35 KB we measured, because the real penalty runs above one RTT. Use a measured penalty, and the section below shows you how to get yours.
The floor matters too. The same page with no hero at all measured 364 ms 360–368, of which 363 ms was render delay while the render-blocking stylesheet made its own round trip. So of the 1,056 ms a 145 KB server-rendered hero costs, 692 ms is addressable by changing the image and the rest is not.
Does this survive a real framework?
A synthetic fixture proves a mechanism but it is still our own code producing numbers we expected. So we repeated the question against a production build of Next.js 16.3.1 with React 19.2.0 — six routes, the same 247 KB source hero, same conditions, 7 cold runs each.
Check your version before you act on this. priority is the prop in Next.js 15 and earlier. As of Next.js 16 it is deprecated in favour of preload, and the image docs go further: "in most cases, you should use loading="eager" or fetchPriority="high" instead of preload". On Next 15 there is no preload prop and priority is what you want.
| Route | LCP | run range | load delay | LCP resource |
|---|---|---|---|---|
<Image> eager, no sizes | 2,980 ms | 2,980–2,984 | 163.7 ms | 407,912 B WebP, w=3840 |
Plain <img src="/hero.jpg"> | 2,204 ms | 2,196–2,220 | 167.7 ms | 252,729 B JPEG |
<Image> default (lazy) | 1,360 ms | 1,352–1,364 | 418.2 ms | 66,580 B WebP, w=750 |
<Image preload sizes="100vw"> | 1,320 ms | 1,312–1,332 | 164.8 ms | 66,580 B WebP, w=750 |
<Image> eager, sizes="100vw" | 1,320 ms | 1,312–1,324 | 164.3 ms | 66,580 B WebP, w=750 |
<Image> eager, layout-matched sizes | 1,320 ms | 1,316–1,324 | 164.2 ms | 66,580 B WebP, w=750 |
Read the top row first, because it is the one that surprised us.
A missing sizes prop cost 1,660 ms, and made next/image worse than no optimizer at all. Without sizes, the browser has no way to know how wide the image will render, falls back to assuming the full viewport width at the device's pixel density, and picks the largest candidate in the srcSet — w=3840, 407,912 bytes. That is 776 ms slower than shipping the plain unoptimised JPEG. Adding sizes="100vw" moves it to the 750w candidate at 66,580 bytes and takes 1,660 ms off. Our fixture's slope predicts that: 333.3 KB × 4.888 ms/KB = 1,629 ms against 1,660 measured, within 2%.
So the ordering for a next/image hero is: get sizes right, then worry about everything else. It is worth 40 times the discovery flag on this page.
The layout-matched sizes route measured identically to sizes="100vw" and fetched the same candidate, which is what should happen at a 412px viewport — both resolve to the same width because the hero fills the column. That route earns its place by showing the difference only appears where the layout caps the image, not on a phone.
The optimizer changed the format too, and it did not help. Every next/image route was served image/webp, because Next 16 defaults images.formats to ["image/webp"]. Requesting the identical URL with Accept: image/jpeg returns 40,281 bytes where the WebP is 66,580 — the WebP is 65% larger. Same at the 3840w candidate: 287,539 bytes as JPEG against 407,912 as WebP. So the 884 ms that separates the plain <img> from the best <Image> config bundles three changes — downscale 1600→750, requantise to q=75, and a format swap that worked against us — and cannot be attributed to any one of them. Do not read that 884 ms as "what next/image is worth."
A caveat on that format result, because it cuts against the usual advice: our hero is synthetic grain, and fine noise is the case WebP handles worst relative to JPEG. Do not conclude WebP is a bad choice for your photographs. Conclude that the optimizer's format decision is a measurement, not a given, and check what yours actually ships. The format probe is four fetches.
The discovery findings survive intact, and stay small. preload and loading="eager" measured identically at 1,320 ms — as they must, because the served HTML shows Next emits the same <link rel="preload" as="image" imageSrcSet=...> for both, differing only by fetchPriority on the link. Both beat the lazy default by 40 ms, with non-overlapping ranges. That is real, and it is 41 times smaller than the sizes fix on the same page.
Bandwidth contention explains why the flag returns so little. The lazy default starts the hero 253.9 ms later than eager (418.2 vs 164.3 ms of load delay) but downloads it 224.6 ms faster (908.2 vs 1,132.8 ms), because by then the page's CSS and JavaScript have stopped competing for the link. Those two phase deltas leave about 29 ms against a measured 40 ms LCP difference — the two do not reconcile exactly, because phase medians and LCP medians are separate statistics over the same runs. Either way the net is an order of magnitude below the sizes win.
One thing we did not expect: the plain-<img> route's HTML contains <link rel="preload" href="/hero.jpg" as="image">, which we did not write. React 19 emits preload links for server-rendered images automatically. Its load delay is 167.7 ms, in line with the other directly-discoverable routes.
Do not compare the Next.js numbers against the fixture table directly — different pages, different sessions, framework JavaScript competing for bandwidth, and a different image format. Compare rows within a table.
Each fix, sized, and when it is wrong
Get sizes right on a responsive image. The largest number in this article: 1,660 ms in our Next.js run, because without it the browser fetched the 3840w candidate (407,912 bytes) instead of the 750w one (66,580 bytes). Worth KB saved × your ms per KB, and the KB saved can be most of the file. When it is wrong: a sizes that understates your layout gives you a blurry hero on wide viewports, so match it to the CSS rather than shrinking it for the metric — then confirm in the network panel which candidate actually got fetched.
Resize and re-encode the hero. Worth KB saved × 4.888 ms on Slow 4G, × 0.899 ms on Fast 4G. When it is wrong: below the crossover there is nothing to win, and quality is a commercial decision. Our 18 KB encoding is visibly blocky; the 145 KB one is not.
Serve the image from the server-rendered HTML. Worth about one RTT: 173.9 ms on Slow 4G, 62.1 ms on Fast 4G. When it is wrong: when the hero genuinely depends on client state, such as a personalised or A/B-tested image. Then server-render a sensible default rather than nothing.
Remove loading="lazy" from the hero. Worth 173.0 ms on Slow 4G, 60.7 ms on Fast 4G, and it is the cheapest edit here. When it is wrong: when the element is not actually the LCP element on the viewport you care about. Un-lazying images below the fold costs bandwidth your real LCP image then competes for — which, per the Next.js result, can take back more than the discovery fix gained.
Move the image out of CSS background-image into an <img>. Worth 162.1 ms on Slow 4G, 43.8 ms on Fast 4G, and it gets you srcset and alt text — which, given the row above, is the bigger prize. When it is wrong: when the image is genuinely decorative. If you are keeping it in CSS for background-size: cover, note that object-fit: cover on an <img> is the same behaviour in one declaration — our own fixture uses exactly that for the four <img> variants.
If you are keeping the CSS background for other reasons, preload it: that recovered 161.7 ms of the 162.1 ms load-delay penalty. Two caveats on that one. It is a single cell — 145 KB, Slow 4G, 9 runs — not the six-weight, two-network sweep the rest of the table rests on. And we did not test it against a media-queried background: if your CSS serves a different crop below some breakpoint, a single preload URL will fetch a file the page then does not use, which looks exactly like "preload did nothing" while also costing you the bytes. That mechanism is reasoned from the `srcset` case, not measured.
Add preload or fetchpriority="high". Worth 0 ms on an <img> the parser can already see, and 152–168 ms on one it cannot. When it is wrong: whenever you have not first checked which of those two you have. Preloading an image that also has a srcset risks fetching a candidate the browser then does not use, so give the preload the same imagesrcset and imagesizes.
When these numbers do not apply
- TTFB is excluded. Our fixture is localhost; median TTFB across all 217 Slow 4G runs was 0.9 ms (range 0.6–9.3). web.dev puts TTFB at about 40% of field LCP.
- Format is measured only in the Next.js section, and only as a byproduct. The weight sweep is JPEG throughout. The Next routes were served WebP, and for our synthetic grainy hero the WebP came out 65% larger than the JPEG at the same width and quality (66,580 vs 40,281 bytes). That is a property of this image, not of WebP — but it does mean no number here tells you what AVIF or WebP is worth on a real photograph, which may well be your largest single win.
- One image, one viewport. A single 1600x900 JPEG at 412x823. Pages whose LCP element is text, a video poster, or one of several competing candidates behave differently.
- Synthetic pages. Ours has a stylesheet and some text. Real pages have fonts, third-party scripts and analytics competing for the connection, and the Next.js run shows contention can halve the value of a discovery fix.
- Lab, not field. Cold-cache first loads. Your CrUX LCP includes repeat visits with a warm cache, where the image costs close to nothing and TTFB dominates. Nothing here tells you how many KB shifts a 75th percentile.
- Our throttling is not PageSpeed Insights' throttling. This matters if your ticket came from a PSI report. Lighthouse simulates rather than applies throttling, and its Slow 4G is 1474.56 kbps with 562.5 ms of request latency — an effective 5.425 ms/KB against our 4.888, about 11% steeper. Running Lighthouse against the same 804 KB page in our own fixture reports LCP 5,101 ms where our measurement says 4,276 ms. Neither is wrong; they are different throttling models. Budget with the steeper slope if you are being graded by PSI: it also moves the crossover, to 162.1 ÷ 5.425 = 30 KB. The full Lighthouse report is in the evidence folder.
Measure your own page
Get your own two numbers first
The crossover needs your users' round-trip time and your own measured penalty, not ours.
Round trip to your origin — TCP connect is close enough to one RTT:
for i in 1 2 3 4 5; do
  curl -o /dev/null -s -w "%{time_connect}\n" https://your-site.example/
done
Bandwidth: take it from field data, not your desk. PageSpeed Insights shows the CrUX distribution for your origin, and most RUM tools record navigator.connection.effectiveType. For brackets, the DevTools presets used here are 204.8 KB/s (Slow 4G) and 1,125 KB/s (Fast 4G); dividing 1000 by those gives the theoretical 4.883 and 0.889 ms/KB that our fitted 4.888 and 0.899 sit alongside.
Then find which phase is yours
This names the element that won LCP, the resource behind it, its byte count, and the four-phase split:
new PerformanceObserver((list) => {
  const e = list.getEntries().at(-1);
  const nav = performance.getEntriesByType('navigation')[0];
  const ttfb = nav.responseStart;
  const res = e.url && performance.getEntriesByName(e.url)[0];
  const reqStart = res ? (res.requestStart || res.startTime) : ttfb;
  const resEnd = res ? res.responseEnd : ttfb;
  console.table({
    element: e.element ? e.element.tagName + (e.element.id ? '#' + e.element.id : '') : '(gone)',
    resource: e.url || '(text element)',
    kb: res ? Math.round(res.encodedBodySize / 1024) : 0,
    lcp: Math.round(e.startTime),
    ttfb: Math.round(ttfb),
    loadDelay: Math.round(reqStart - ttfb),
    loadTime: Math.round(resEnd - reqStart),
    renderDelay: Math.round(e.startTime - resEnd),
  });
}).observe({ type: 'largest-contentful-paint', buffered: true });
Then:
loadDelaymuch above your measured RTT means something is hiding the image. Checkloading="lazy"on the hero, then the image living in CSS, then the image being client-rendered. The DevTools network panel's Initiator column settles it — if it names a script or a stylesheet rather than the document, that is your answer.
To size the fix, do not subtract bare RTT. A healthy load delay is not RTT, it is RTT plus a bit: our directly-discoverable image measured 164.3 ms against a 150 ms RTT on Slow 4G, and 52.1 ms against 40 ms on Fast 4G. Subtracting raw RTT therefore overstates the fix by 9% on Slow 4G and 28% on Fast. Get your own baseline instead: put a plain server-rendered<img>on the same page, read itsloadDelayfrom the same snippet, and your fix is worthyour hero's loadDelay − that baseline.loadTimedominating, withkbabove your crossover, means compress or fixsizes. Multiply the KB you can save by1000 ÷ your bandwidth in KB/s.renderDelaydominating means the paint is blocked and no image change will help.
One important caveat on kb. If your hero is served cross-origin — a CDN, Cloudinary, Photon, Cloudflare Images — and the response has no Timing-Allow-Origin header, then encodedBodySize is 0 and this snippet prints kb: 0. That is the input to the crossover rule, so a reader on a CDN can wrongly conclude their hero is weightless. Check the byte count in the DevTools network panel instead, or add the header. (requestStart is also zeroed, but the || res.startTime fallback covers that, so loadDelay stays usable.)
console.table is a one-off diagnosis, not monitoring. For real users use the web-vitals library's attribution build, which reports the same breakdown from actual visits.
Related guides
- Fix Cumulative Layout Shift — the other metric a badly-declared hero image damages
- Improve your INP score — the interaction metric, which none of the above affects
- Next.js bundle size — for when the JavaScript, not the image, is competing for the connection
Methodology and raw data
Fixture generators, benchmark scripts, all three results files, the Lighthouse report, the unedited DevTools captures, and the measurement library itself: /evidence/how-to-improve-lcp/.
Measured in headless Chrome for Testing 150.0.7871.24 via the Chrome DevTools Protocol, with a fresh browser context and cleared cache per run, on an Apple M5 (10 cores, 16 GB), macOS 26.5.1, Node 24.16.0. Hero images encoded with mozjpeg via sharp 0.35.1 at 4:2:0 chroma subsampling. Next.js experiment on 16.3.1 / React 19.2.0 in a production next start build. Every page settles on network idle before metrics are read, because a lazily-loaded hero does not block the load event and a fixed timeout reports a text LCP instead — an error that made the slowest variant look like the fastest in our first pass.