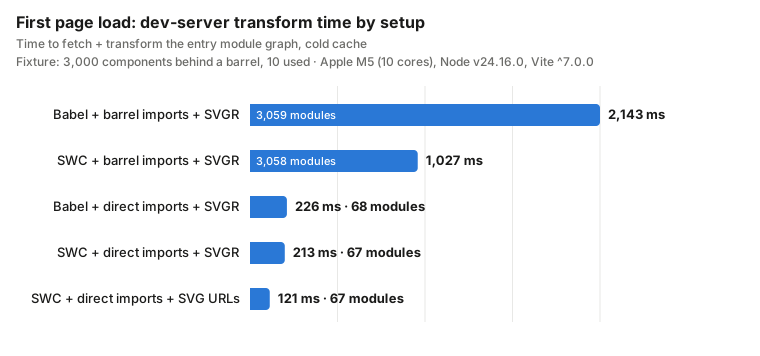
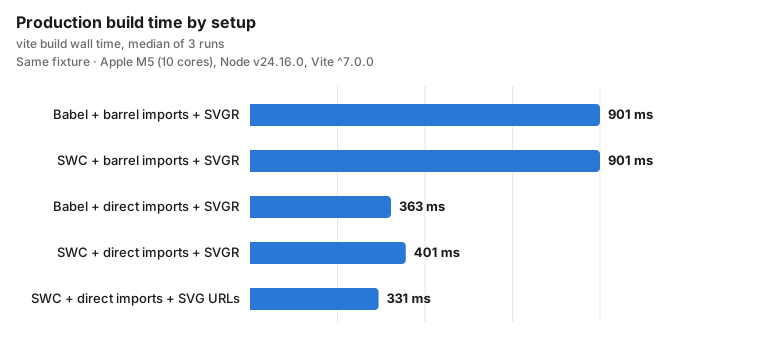
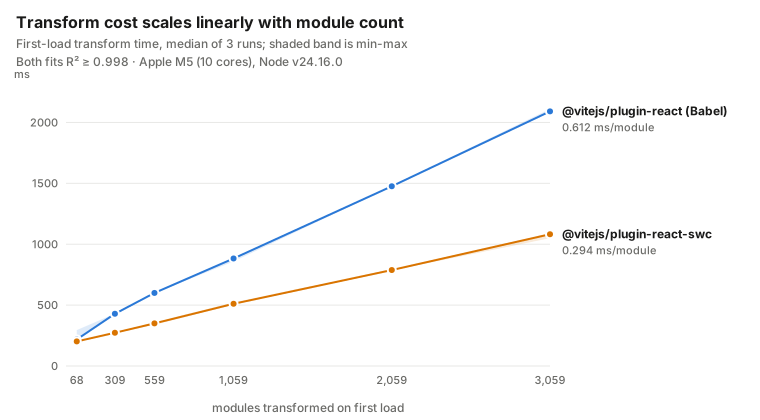
Every number in 4 Things Making Your Vite Dev Server Slow comes from these files. Measured on an Apple M5 (10 cores), Node v24.16.0, Vite 7.
| File | What's in it |
|---|---|
| bench-results.json | The five-configuration matrix: cold start (5 runs), first-load module-graph crawl, HMR round-trip, production build (3 runs), and dist chunk tables. Records machine specs and dependency versions. |
| sweep-results.json | Module-count sweep from 68 to 3,059 modules against both React plugins, 3 runs per cell, plus the fitted per-module cost and the real @mui/icons-material comparison. |
| mui-warm.json | Cold vs warm dependency-cache runs for the MUI icon barrel — the test that shows most of its cold cost is esbuild pre-bundling. |
| File | Produced by |
|---|---|
| bench.txt | node bench.mjs |
| sweep.txt | node sweep.mjs |
| mui-warm.txt | node mui-warm.mjs |
| File | What it does |
|---|---|
| gen.mjs | Generates the fixture: N components behind a barrel index.js, 50 SVG icons, three app variants. Size set by FIXTURE_COMPONENTS (default 3000). |
| bench.mjs | The five-configuration matrix. Starts a real dev server per run, crawls the entry module graph the way a browser does, drives HMR over Vite's websocket. |
| sweep.mjs | The module-count sweep, the linear fit, and the third-party package comparison. |
| mui-warm.mjs | Cold/warm dependency-cache test for the pre-bundling hypothesis. |
| charts.mjs | Renders the article's SVG charts directly from the results JSON — no numbers are typed by hand. |
The fixture source is generated, so it isn't committed. From evidence/articles/vite-react-performance/fixtures/ in the PageSpeedFix repo:
node gen.mjs
npm install
node bench.mjs
node sweep.mjs
node mui-warm.mjs
Absolute timings depend on your machine. The ratios, the linear fit, and the module counts should reproduce.
first-load-transform.svg · build-time.svg · module-count-sweep.svg