Vite's own performance guide leads with avoiding barrel files and warns that "importing many modules at once" is a common cause of slow starts; the troubleshooting guide points at the React plugin. Most write-ups compress that into the same four fixes: stop using barrel files, switch to SWC, don't transform SVGs into components, and split your chunks. We got tired of repeating those claims without numbers, so we built a reproducible fixture — a React app with 3,000 components behind a barrel file and 50 SVG icons — and measured each fix, in sequence and in isolation.
The fixes all check out. But the sizes are wildly uneven, one of them only works while your setup is still broken in another way, and the metric most people stare at ("ready in 93ms!") turned out to measure nothing at all.
Ten seconds first, to see whether this article is for you. Edit a component and watch the browser console. [vite] hot updated means React Fast Refresh handled it — our measurements say none of the four fixes below will change that, and you want the when these fixes won't help section instead. [vite] page reload means the edit fell back to a full reload, which pays the first-load cost this article measures, and the barrel fix is your answer. Everything below is about first load; that one console line tells you whether first load is your problem.
What we measured
The fixture is a Vite 7 React app generated by a script, so every run starts from identical code:
- 3,000 components, all re-exported by a
components/index.jsbarrel file, with 10 actually imported by the page — the shape of any real app that grew an index file - 50 SVG icons, imported either as components (via
vite-plugin-svgr) or as URLs - Test machine: Apple M5 (10 cores), Node 24, macOS. Numbers will differ on your machine; the ratios are the finding.
For each configuration we measured, with a cold cache each time:
- Cold start — Vite's own "ready in" figure, median of 5 runs
- First page load — the time to fetch and transform the entry module graph the way a browser does — following each import to the next request, though at a fixed concurrency of 8 rather than the browser's own scheduling, so it is a close proxy rather than a replica
- HMR round-trip — edit one component, time until the update arrives over Vite's websocket, median of 3
- Production build —
vite buildwall time, median of 3
The fixture generator, all three benchmark scripts, the raw terminal transcripts, and the results JSON are published in our evidence folder — bench-results.json, sweep-results.json, and the unedited run logs (bench.txt, sweep.txt) — so you can check our arithmetic or rerun the whole thing with node gen.mjs && npm install && node bench.mjs.
The headline: fix order matters
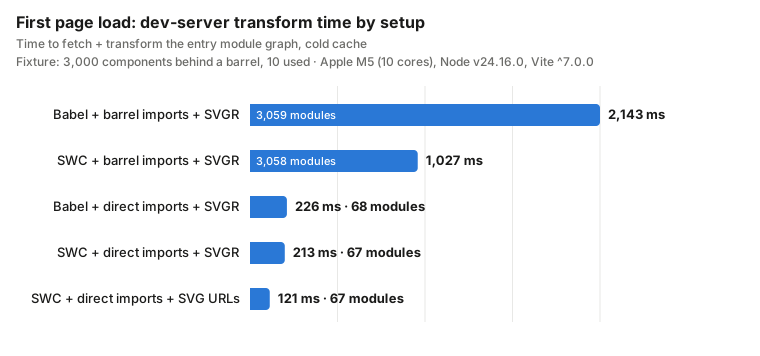
| Setup | Modules on first load | First load | HMR round-trip | Build |
|---|---|---|---|---|
| Babel + barrel imports + SVGR | 3,059 | 2,143 ms | 25 ms | 901 ms |
| SWC + barrel imports + SVGR | 3,058 | 1,027 ms | 28 ms | 901 ms |
| Babel + direct imports + SVGR | 68 | 226 ms | 113 ms | 363 ms |
| SWC + direct imports + SVGR | 67 | 213 ms | 101 ms | 401 ms |
| SWC + direct imports + SVG URLs | 67 | 121 ms | 91 ms | 331 ms |
First load is a median of 3 crawls, build a median of 3 runs, cold start a median of 5.
One caveat on reading these two tables together: this table and the sweep below are separate benchmark runs, executed in different sessions from the same fixture. That is why the barrel row here says 2,143 ms while the sweep reports 2,091 ms 2,085–2,111 at the same 3,059 modules — the same configuration, measured twice. Within a run the spread is tight — at most 79 ms, which is the noise floor used throughout this article, though that figure comes from a single cell (Babel at 68 modules, 216–295); most cells spread under 25 ms, so treat 79 ms as a deliberately conservative bar rather than a typical one. Across runs it is wider still, because machine state differs. Compare rows within a table, not between them.
Three things jump out of this table that the standard advice gets subtly wrong:
- The barrel file is the whole story. Direct imports took first load from 2,143ms to 226ms — 9.5× — because Vite stopped transforming 2,991 modules nobody asked for.
- SWC only matters while you still have the barrel. With 3,000 modules to transform, SWC halved the time (2,143 → 1,027ms). With 68 modules, the 13ms gap (226 vs 213ms) sits well inside the 79ms noise band. SWC makes each transform cheaper; direct imports remove the transforms. If you only have time for one change, it's not the compiler swap.
- "Ready in 93ms" was true in every single configuration — including the one that took 2.1 seconds to serve a page. Vite compiles lazily, so startup time measures almost nothing. If you're benchmarking your own fixes by watching the startup line, you're measuring the wrong thing.
Now each fix, with what it's actually worth.
What it costs per module, and where SWC starts to pay
Two configurations tell you the endpoints but not your own position between them. So we swept the fixture from 68 to 3,059 modules against both plugins, three cold runs per cell.
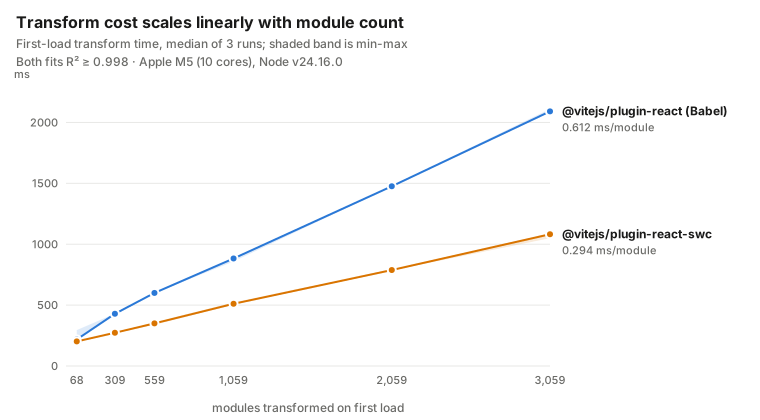
| Modules | Babel | SWC |
|---|---|---|
| 68 | 218 ms 216–295 | 202 ms 198–205 |
| 309 | 429 ms 417–430 | 273 ms 270–273 |
| 559 | 600 ms 599–609 | 350 ms 338–359 |
| 1,059 | 883 ms 859–889 | 511 ms 504–522 |
| 2,059 | 1,476 ms 1,474–1,479 | 788 ms 785–795 |
| 3,059 | 2,091 ms 2,085–2,111 | 1,082 ms 1,050–1,091 |
The cost is almost perfectly linear in module count, which gives you a formula instead of an anecdote:
Babel:  first load ≈ 224 ms + 0.612 ms × modules    (R² = 0.998)
SWC:    first load ≈ 186 ms + 0.294 ms × modules    (R² = 1.000)
Two things follow that you can apply to your own app. SWC saves about 0.32ms per module, so it only clears the 79ms noise band above roughly 250 modules on the first-load path — below that, the compiler swap is unmeasurable, which is exactly what the flat comparison at 68 modules showed. And the fixed overhead (~200ms) is the price of the entry graph regardless of plugin, so no configuration change gets you below it.
Note the shape of the claim: this fit is for React component modules of a similar size on one machine. Your constant will differ; the linearity is the transferable part, so measure two points on your own app and interpolate rather than borrowing our slope.
Fix 1: Stop importing through barrel files (9.5× first load)
Barrel files are the index.js files that re-export everything:
// components/index.js (barrel file)
export { Button } from './Button';
export { Card } from './Card';
// ... 2,998 more exports
// Slow — Vite transforms ALL 3,000 exports even though you want one
import { Button } from '@/components';
// Fast — Vite transforms Button and its own imports, nothing else
import { Button } from '@/components/Button';
In the fixture this is the difference between 3,059 modules / 2,143ms and 68 modules / 226ms on first load — and it hits production builds just as hard, 901ms down to 363ms. Nothing else we tested comes close.
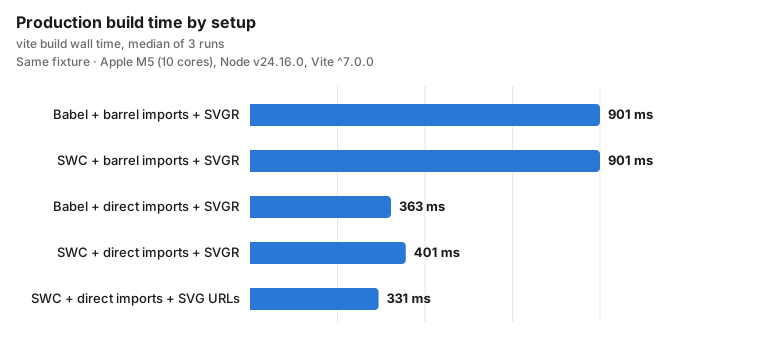
Note what the build chart shows about the compiler swap: the two barrel rows are identical at 901ms, and SWC is marginally slower than Babel on the direct-import build (401ms vs 363ms). Production builds hand most of the work to esbuild and Rollup regardless of which React plugin you choose, so the plugin decision is a dev-server decision, not a CI one.
To find your own barrel imports, this finds imports that stop at a directory rather than a file:
rg -n "from ['\"][^'\"]*/(components|ui|icons|utils|hooks|lib)['\"]" src/
When fixing this is the wrong call. Killing a barrel that a thousand call sites import is not a two-minute edit — it is a mechanical refactor across the codebase with real regression risk, and if the barrel is the public entry point of a shared internal package, removing it breaks every consumer. Do it with a codemod rather than by hand, and once converted, keep it converted with an ESLint rule:
// eslint.config.js
'no-restricted-imports': ['error', {
  patterns: [{ group: ['@/components', '@/components/index'], message: 'Import the component file directly.' }],
}],
If the barrel is small (a few dozen exports), leave it alone — the cost scales with what the barrel pulls in, and our sweep below shows where it starts to matter.
Third-party barrels are a different problem with the same symptom
Everything above is our own generated code, so we ran the same comparison against a package we didn't write: @mui/icons-material@9.3.1, importing 10 icons two ways.
| Import style | Modules | First load (cold dep cache) | First load (warm) | Source served |
|---|---|---|---|---|
import { Add, Delete } from '@mui/icons-material' | 7 | 689 ms | 99 ms | 7,902 KB |
import Add from '@mui/icons-material/Add' | 17 | 124 ms | 51 ms | 2,346 KB |
The barrel version loads fewer modules and is still 5.6× slower cold. That inverts the mechanism from the source-barrel case, and the two columns on the right explain why.
Vite treats node_modules differently from your source. Source modules are served individually over ESM, so a source barrel's cost is module count — 3,000 requests to transform. A dependency, by contrast, gets pre-bundled by esbuild into a handful of optimized chunks before anything is served. That collapses the count to 7, but the chunk it produces contains the whole icon package: about 7.9 MB of JavaScript served to the browser instead of about 2.3 MB, and a one-off pre-bundling cost that dominates the cold number (689ms cold vs 99ms warm — about 85% of it is optimizeDeps work that a warm node_modules/.vite cache skips).
So the practical advice differs by barrel type:
- Your own barrels cost you on every cold page load, forever, in proportion to module count.
- Dependency barrels cost you once per dependency-cache invalidation — a fresh clone, a lockfile change, a new dependency — and then again on every cold first load until the cache warms.
Both are dev-time costs. Neither reaches production: @mui/icons-material publishes ESM with sideEffects: false, so Rollup tree-shakes the unused icons out of the production build regardless of how you imported them. We confirmed this separately — barrel and path imports produce byte-identical production bundles. Fix your icon imports for the dev server and your build times, not for your users.
This is also why "just use optimizeDeps.include" doesn't fix an icon barrel: the pre-bundling is not the durable cost, the payload is.
Fix 2: SWC — real, but only above ~250 modules
SWC is routinely described as the single biggest dev-server speedup available. Our data says it's a per-module speedup, so its value is proportional to how many modules you're wastefully transforming — which makes it a large win or an unmeasurable one depending entirely on what you fixed first.
npm uninstall @vitejs/plugin-react
npm install @vitejs/plugin-react-swc
- With the barrel (3,059 modules): 2,143ms → 1,027ms first load. Worth having.
- With direct imports (68 modules): 226ms → 213ms. Inside run-to-run noise.
- Production build: no measurable difference in either case (builds use esbuild/Rollup for most of the work anyway).
So do the swap — it's five minutes and it buys real headroom on large graphs — but do it second, and don't expect it to rescue an app that's transforming thousands of unnecessary modules. One caution that survives from the old advice: if you stay on @vitejs/plugin-react, don't add custom Babel options unless you need them, since they disable the fast path.
When this swap is blocked. SWC does not run Babel plugins, so anything in your build that depends on one is a hard blocker, not a migration detail: Emotion's @emotion/babel-plugin (source maps and component labels), styled-components' Babel macro, Relay's babel-plugin-relay, and any bespoke transform in your babel.config.js. Some have SWC equivalents (@vitejs/plugin-react-swc exposes options for Emotion and styled-components); some don't. Check your Babel config before you uninstall anything — and given the numbers above, if your import graph is already lean, staying on Babel costs you almost nothing.
Fix 3: Import SVGs as URLs, not components (92ms for 50 icons)
With vite-plugin-svgr, every icon becomes a React component that must be transformed:
// Each of these is a module transform on first load
import Logo from './logo.svg?react';

// This is a static asset request — no transform
import logoUrl from './logo.svg';
<img src={logoUrl} alt="Logo" width={120} height={40} />
Our 50 icons cost 92ms of first-load time as components (213ms → 121ms after switching to URLs), plus 70ms of build time. We measured one icon count, so treat that as a 92ms delta at n=50 rather than a per-icon rate you can extrapolate — the transform cost per icon isn't necessarily linear.
When URLs are the wrong choice. An <img> can't inherit currentColor, take props, or be styled by CSS that targets its internals — so any icon that changes color on hover, follows a theme, or animates a path needs to stay a component. mask-image recovers single-color theming with URL economics, but it can't do multi-color icons and needs a fallback for older browsers. The pragmatic split: URLs for the long tail of static icons, components for the handful that are genuinely interactive.
The HMR result we didn't expect
We assumed the barrel would also wreck hot module replacement. It didn't.
Editing a single component gave a median round-trip of 13.5ms with the barrel and 13.7ms without it — a 0.2ms difference across 15 samples each, against a standard deviation of about 42ms. Statistically identical. React Fast Refresh keeps the update local to the edited module, so the 3,000-module barrel never re-enters the picture on a leaf edit.
That standard deviation deserves a word, because it explains something you have probably hit. The distribution is heavily right-skewed: most edits land near 12–14ms, but occasional ones exceed 100ms. Our first pass took only 3 samples per configuration and happened to catch 25ms for the barrel against 113ms for direct imports — an apparent 4x regression that was entirely a sampling artefact, and one a reader was right to query. If you time your own HMR once and conclude something changed, you have probably measured the same ghost. Take ten samples.
This matters for diagnosis: if your HMR takes seconds, none of the four standard fixes is your problem. Slow HMR at that scale usually means an edit is invalidating a module with a huge import graph (editing the barrel itself, a theme file, or a module with side effects), a CSS-in-JS transform running per update, a plugin doing work in handleHotUpdate — or the browser issues below. Profile before you refactor: vite --profile, then press p and upload the CPU profile to speedscope.app.
Fix 4: manualChunks — it's about caching, not speed
Without configuration, our fixture built to a single 161.0KB JavaScript file. With a two-line manualChunks:
// vite.config.js
export default {
  build: {
    rollupOptions: {
      output: {
        manualChunks: {
          vendor: ['react', 'react-dom'],
        },
      },
    },
  },
};
…it became a 140.8KB vendor chunk + 20.1KB app chunk, with build time unchanged (331ms vs 295ms — noise). The win is entirely about what happens after deploys: your app code changes weekly; React doesn't. Split, a returning visitor re-downloads 20.1KB. Unsplit, they re-download all 161.0KB because one line of app code moved — an 87% reduction in bytes-per-deploy for returning visitors. The bigger your dependency set, the more this compounds: the MUI icon barrel measured above put 7.9MB of JavaScript into the graph on its own.
When manual chunking backfires. Rollup already allocates shared modules to chunks automatically, and a hardcoded manualChunks overrides that judgement. Force a module into vendor while another chunk also imports it and you can get it emitted twice, raising total transferred bytes rather than lowering them. Over-splitting has a second cost: each chunk is a request, and chunks that import each other serialize into a waterfall, so a dozen tidy vendor chunks can load slower than three. Split on a boundary you can justify — a library that changes on a different cadence than your app — then check the result in rollup-plugin-visualizer rather than assuming more chunks is better.
For larger apps, group by library family with a function:
manualChunks(id) {
  if (id.includes('node_modules')) {
    if (id.includes('@radix-ui')) return 'vendor-radix';
    if (id.includes('recharts') || id.includes('d3')) return 'vendor-charts';
    if (id.includes('react')) return 'vendor-react';
    return 'vendor';
  }
}
And pair it with route-level code splitting so users only download the pages they visit:
const Dashboard = lazy(() => import('./pages/Dashboard'));
Each route becomes its own chunk, which directly helps LCP on first visits and INP when large chunks would otherwise block the main thread. Run rollup-plugin-visualizer after any chunking change — the usual finds are full lodash, moment with all locales, or two versions of the same package.
When these fixes won't help
Our fixture deliberately isolates source-transform costs. Several real-world slowdowns live outside that boundary, and no amount of barrel-fixing will touch them:
- Dependency pre-bundling. The notorious "30+ second startup" is usually
optimizeDepscrunching a huge dependency tree on first run or after a lockfile change — that's a different cost from anything we measured. If startup (not first load) is your pain, check whether it recurs with a warmnode_modules/.vitecache; if it does, look for dependencies that force re-optimization, and useoptimizeDeps.includefor CJS packages Vite keeps discovering late. - The "Disable cache" trap. With DevTools open and Network → "Disable cache" checked, the browser refetches every module on every reload. This one checkbox can make a healthy dev server feel broken. Uncheck it unless you're actively debugging caching.
- Browser extensions. React DevTools, Redux DevTools, and ad blockers intercept requests; across hundreds of module requests the latency compounds. Test in incognito — if Vite is suddenly fast, binary-search your extensions.
- Firefox. Its ES-module handling is measurably slower for unbundled dev serving; Chrome or Safari are the better dev browsers. If Firefox is non-negotiable, raise
network.http.max-persistent-connections-per-serverinabout:config. - Type checking in the build.
vite builddoesn't type-check, but wrappers that runtscfirst do. Time them separately before blaming Vite.
Vite can also pre-transform known-hot files on boot so the first browser hit is warm:
// vite.config.js
export default {
  server: {
    warmup: {
      clientFiles: ['./src/main.tsx', './src/App.tsx'],
    },
  },
};
Measure your own app in two minutes
Start your dev server, then run this against your entry point. It walks the module graph the way the browser does and reports what Vite actually has to transform on first load:
// count-modules.mjs — node count-modules.mjs http://localhost:5173 /src/main.jsx
const [base, entry = "/src/main.jsx"] = process.argv.slice(2);
const seen = new Set(); const queue = [entry];
const t0 = performance.now();
while (queue.length) {
  // Dedupe within the batch as well as against seen: the same URL can be
  // queued twice by two importers before either is marked visited.
  const batch = [...new Set(queue.splice(0, 8))].filter((u) => !seen.has(u));
  batch.forEach((u) => seen.add(u));
  const bodies = await Promise.all(batch.map(async (u) => {
    const res = await fetch(base + u);
    return (res.headers.get("content-type") || "").includes("javascript") ? res.text() : "";
  }));
  for (const code of bodies)
    for (const m of code.matchAll(/(?:from\s*|^import\s*|import\(\s*)["']([^"']+)["']/gm))
      if (m[1].startsWith("/") && !m[1].startsWith("/@vite/") && !seen.has(m[1])) queue.push(m[1]);
}
console.log(`${seen.size} modules in ${Math.round(performance.now() - t0)}ms`);
Expected output looks like 68 modules in 226ms. Restart the dev server with rm -rf node_modules/.vite first so you're measuring a cold graph, and run it two or three times to see your own spread.
Then read the module count against these bands — they come from the sweep above, so they're calibrated to the same measurement this script performs:
| Modules on one page | Verdict |
|---|---|
| Under 250 | Healthy. The compiler swap won't be measurable; look elsewhere. |
| 250–800 | Normal for a substantial app. SWC now clears the noise floor and is worth the five minutes. |
| 800–2,000 | Suspect. Check whether a barrel or an icon package is pulling in modules the page never renders. |
| Over 2,000 for one page | Barrel confirmed, in practice. No page needs to transform two thousand modules to render. |
The other half of the diagnosis is transfer size: if the module count is low but the dev server still crawls, check how much JavaScript the dev server is serving (DevTools → Network → filter JS) against the icon-barrel numbers above — roughly 8MB from one dependency is the signature of a pre-bundled package barrel. Production is unaffected; this is a dev-server signal only.
Quick wins, in measured order
- Replace barrel imports with direct imports — 9.5× first load, 2.5× build in our fixture. Grep for directory imports; do this first.
- Swap to
@vitejs/plugin-react-swc— 5 minutes; ~2× on first load if your module graph is still large, harmless otherwise. - Icons as URLs (or
mask-image) if you import dozens of SVG components — 92ms for our 50, measured at that count only. manualChunks+ lazy routes — not for speed, for caching: our 161KB monolith became 140.8KB (stable, cached) + 20.1KB (changes with your code).- Verify with the right metric — time your first page load, not the "ready in" line, which was ~93ms in every configuration we tested.
Frequently Asked Questions
My edits are slow, not my page loads. Is this the right article?
Check the browser console first. [vite] hot updated means React Fast Refresh handled it, and our data says none of the four fixes here will help — leaf HMR was 25–113ms in every configuration we tested. [vite] page reload means the update fell back to a full reload, which pays the first-load cost this article measures, so the barrel fix applies directly. That one line tells you which half of the problem you have.
Should I migrate from Create React App to Vite?
Yes. CRA is deprecated, and the migration is usually a config-file exercise. Just don't carry your barrel files over expecting Vite to absorb them — our numbers show that pattern costs more in an unbundled dev server than it did in Webpack.
Why is my Vite build slower than expected?
Check for custom Babel config (disables the fast path), slow plugins, source maps, or a type-check step in your build pipeline. In our fixture the barrel file alone accounted for a 2.5× build-time difference (901ms vs 363ms), so import hygiene shows up in CI too, not just in dev.
Does any of this affect what my users download?
No. Every measurement here is dev-server or build-time. Production bundles were unaffected by import style in our companion MUI benchmark, where barrel and path imports produced byte-identical output. Fix imports for your own iteration speed and CI, not for your Core Web Vitals.
How do I debug Vite performance issues?
vite --profile, interact with the app, press p, and upload the profile to speedscope.app. Look for long plugin hooks and repeated transforms of the same file type. Our benchmark script (in the evidence folder) also shows a simple technique: fetch your own entry module graph with a script and count the modules — if the count is in the thousands for a simple page, you have a barrel problem.
Vite 8 and Rolldown
If you're considering the Vite 8 upgrade: it moves bundling to Rolldown, a Rust bundler, and the gains land mostly in production build times. It does not change the economics above — a barrel file still drags thousands of modules into the graph regardless of who bundles them. For migration details see our Vite 8 and Rolldown guide.
What's next
In the order the data supports — the first item is a codemod, not a coffee break:
- Find barrel imports (10 minutes to find; the conversion is a codemod across every call site, not a coffee break)
- Swap to SWC (5 min) — one install, one config line; pays off in proportion to your graph size
- Add manual chunks (10 min) — split vendor from app code for returning-visitor caching
- Re-measure first page load, not startup (5 min) — cold cache, DevTools Network tab, "Disable cache" off
Methodology and raw data: the fixture generator, benchmark script, and full results (including per-run numbers and machine specs) are in bench-results.json. The charts above are generated from that file.
Related guides:
- Vite 8 and Rolldown for React — What changes in Vite 8 and how to migrate safely
- React performance optimization — Framework-level patterns
- MUI performance guide — If you're using Material UI (and its barrel-style icon imports)
Everything above is a dev-server and build-time problem. If your production Core Web Vitals are also poor, that is a separate investigation — start with what actually lands in your bundle.